Savings on energy bills for millions as price caps fall
- The level of the default price cap will fall by £17 from April, driven by lower wholesale costs
- The level of the pre-payment meter cap will also fall by £17
- The caps protect around 15 million customers in total from being overcharged and they can save even more from shopping around
The default price cap, which protects around 11 million households, is set to fall from £1,179 to £1,162 for the summer period (April - September). The pre-payment meter cap, which protects a further 4 million households, will fall from £1,217 to £1,200 per year for the same six month period.
As a result, energy bills will fall for around 15 million households who are protected by the price caps.
A large part of the reduction in the caps is due to wholesale energy prices continuing to fall between August 2019 and January 2020. A strong supply of gas, such as record amounts of liquefied natural gas and healthy gas stock inventories, has been the main factor pushing down wholesale prices.
As a result, the wholesale energy cost element of the default tariff cap fell from £446 to £408.
These reductions offset cost increases totalling £22 of other elements such as operating costs, network charges, smart meter costs and environmental schemes, resulting in an overall reduction of £17 in the level of the default tariff cap.
During 2019, households protected by the default price cap are estimated to have saved £1 billion on their energy bills.
More savings were unlocked by households since the default cap was introduced on 1 January 2019 as switching rates reached an all-time high in April 2019.
Currently, switching away from a default tariff to a cheaper deal could save a typical household up to £305. Households are encouraged to shop around to access these savings.
Ofgem closely monitors all suppliers’ approaches to complying with the cap and has taken tough action when they have not met their obligations.
This summer, Ofgem will carry out a review for the Secretary of State on whether the market conditions exist for the default price cap to be lifted or be extended past 2020.
Jonathan Brearley, chief executive at Ofgem, said:
“The default price cap is designed to protect consumers who do not switch from overpaying for their energy, whilst encouraging competition in the retail market.
“Suppliers have been required to become more efficient and pass on savings to consumers. In its first year, the cap is estimated to have saved consumers £1 billion on average on their energy bills and switching rates have hit record levels.
“Today’s announcement is further good news for the 15 million households covered by both price caps who will see their energy bills fall in April. Households can reduce their energy bills further by shopping around for a better deal.”
Notes to editors
1. The default tariff price cap, which was introduced on 1 January 2019, protects around 11 million households on default, including standard variable, tariffs. The pre-payment meter price cap, which was introduced on 1 April 2017, protects around 4 million households who pre-pay for their energy.
2. The price caps are a cap on a unit of gas and electricity, with standing charges taken into account. They are not a cap on customers’ overall energy bills, which will still rise or fall in line with their energy consumption.
3. Ofgem analysis at the time the default tariff cap was introduced suggests that the default tariff price cap would have reduced the price of the average standard variable tariffs from the six largest suppliers by around £75 to £100 per year since April 2015 had it been in place over this period. The chart below shows these suppliers have consistently charged more than the indicative level of the default tariff cap, which reflects the estimated costs of an efficient supplier. This analysis suggests had the cap not been introduced on 1 January, customers would be paying significantly more. However, it is impossible to estimate an exact savings figure going forward as suppliers can no longer price above the level of the cap.
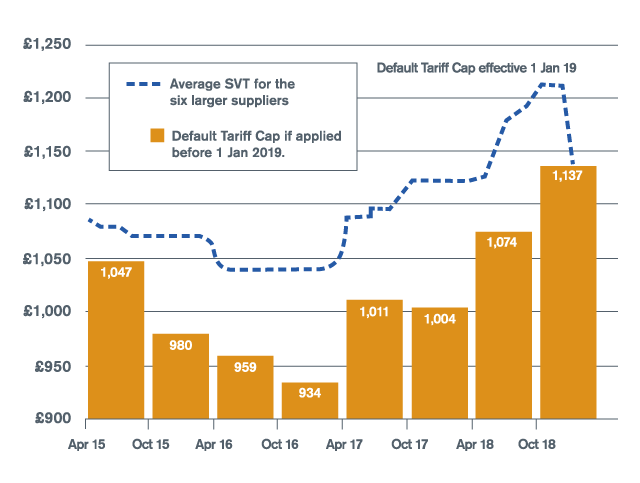
Data for this graph can be found on the Data table: Standard variable tariff prices compared to the default tariff cap level if applied before 2019 page
4. Suppliers buy electricity and gas on the wholesale markets in advance, purchasing ‘forward contracts’ gradually over time. The default tariff price reflects suppliers’ costs because we use the wholesale prices of the relevant forward contracts that were sold in advance during an ‘observation window’ before each 6 month price cap period. The observation window for the winter price cap period (October – March) is the previous February - July. The observation window for the summer price cap period (April - September) is the previous August - January. The graphs below show a) how wholesale gas and electricity prices for the relevant contracts on offer in each observation window result in an allowance that reflects suppliers’ average costs:
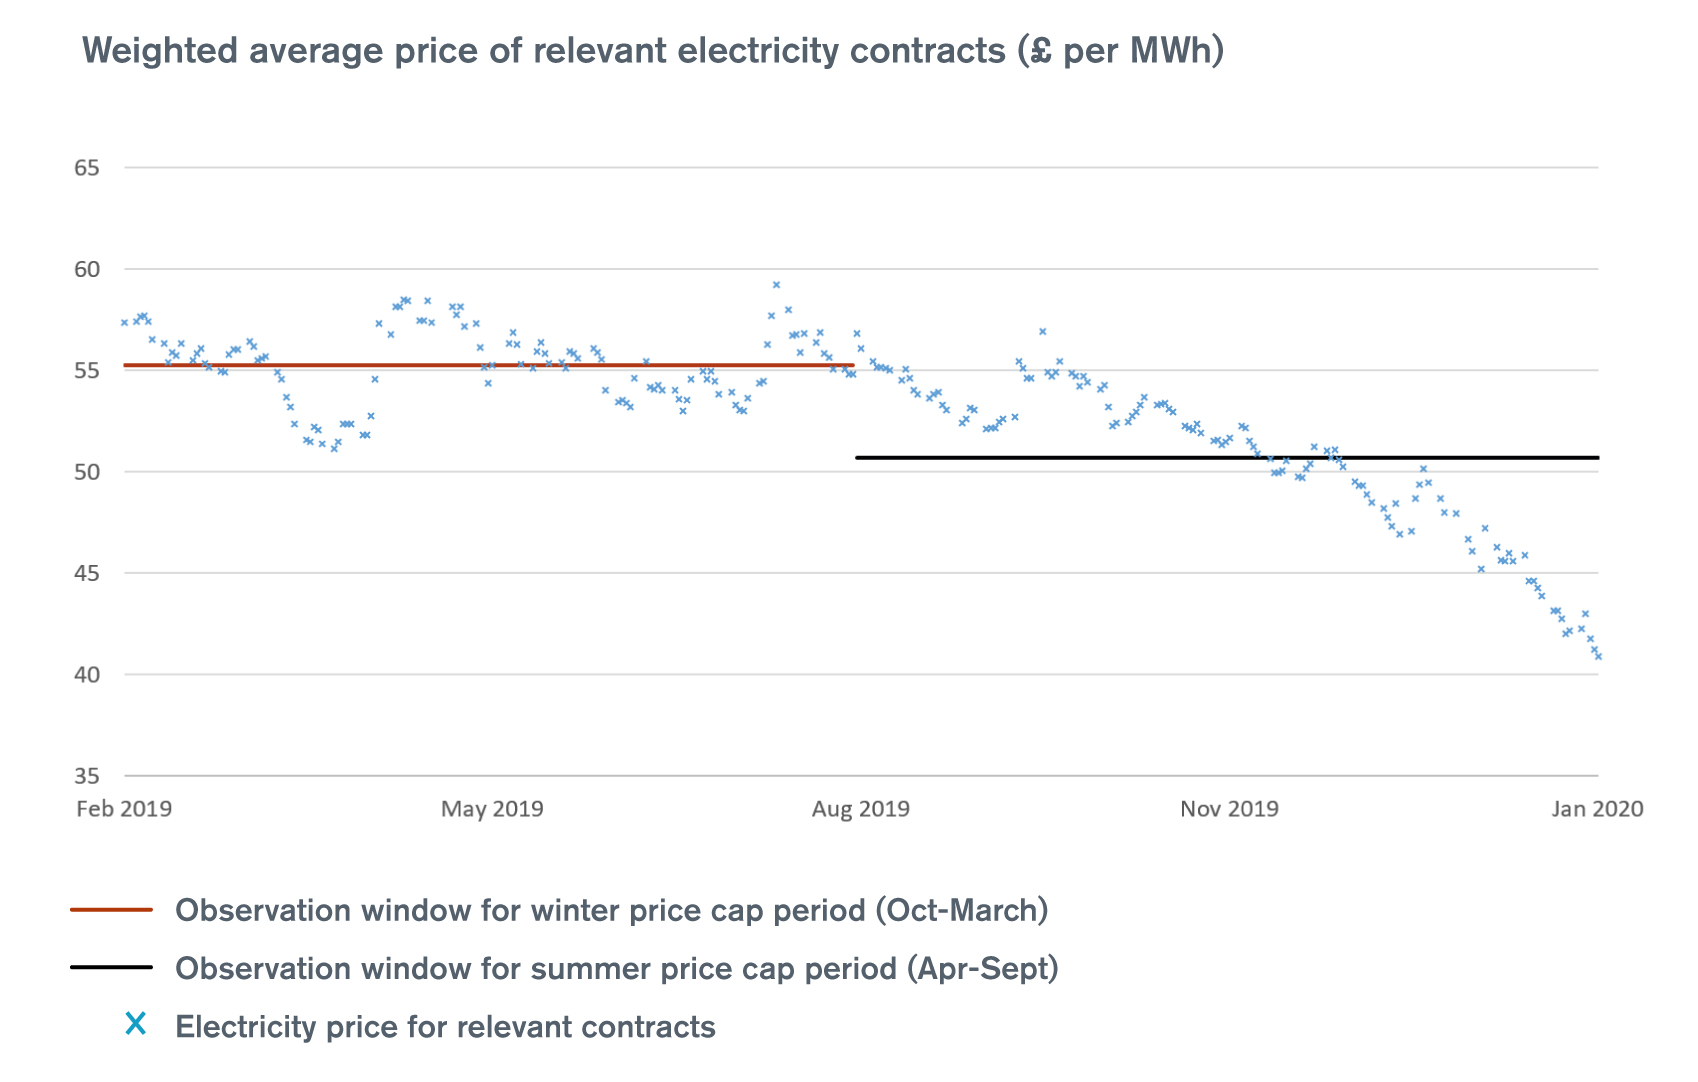
Data sets behind this graph are proprietary, and can be sourced from ICIS
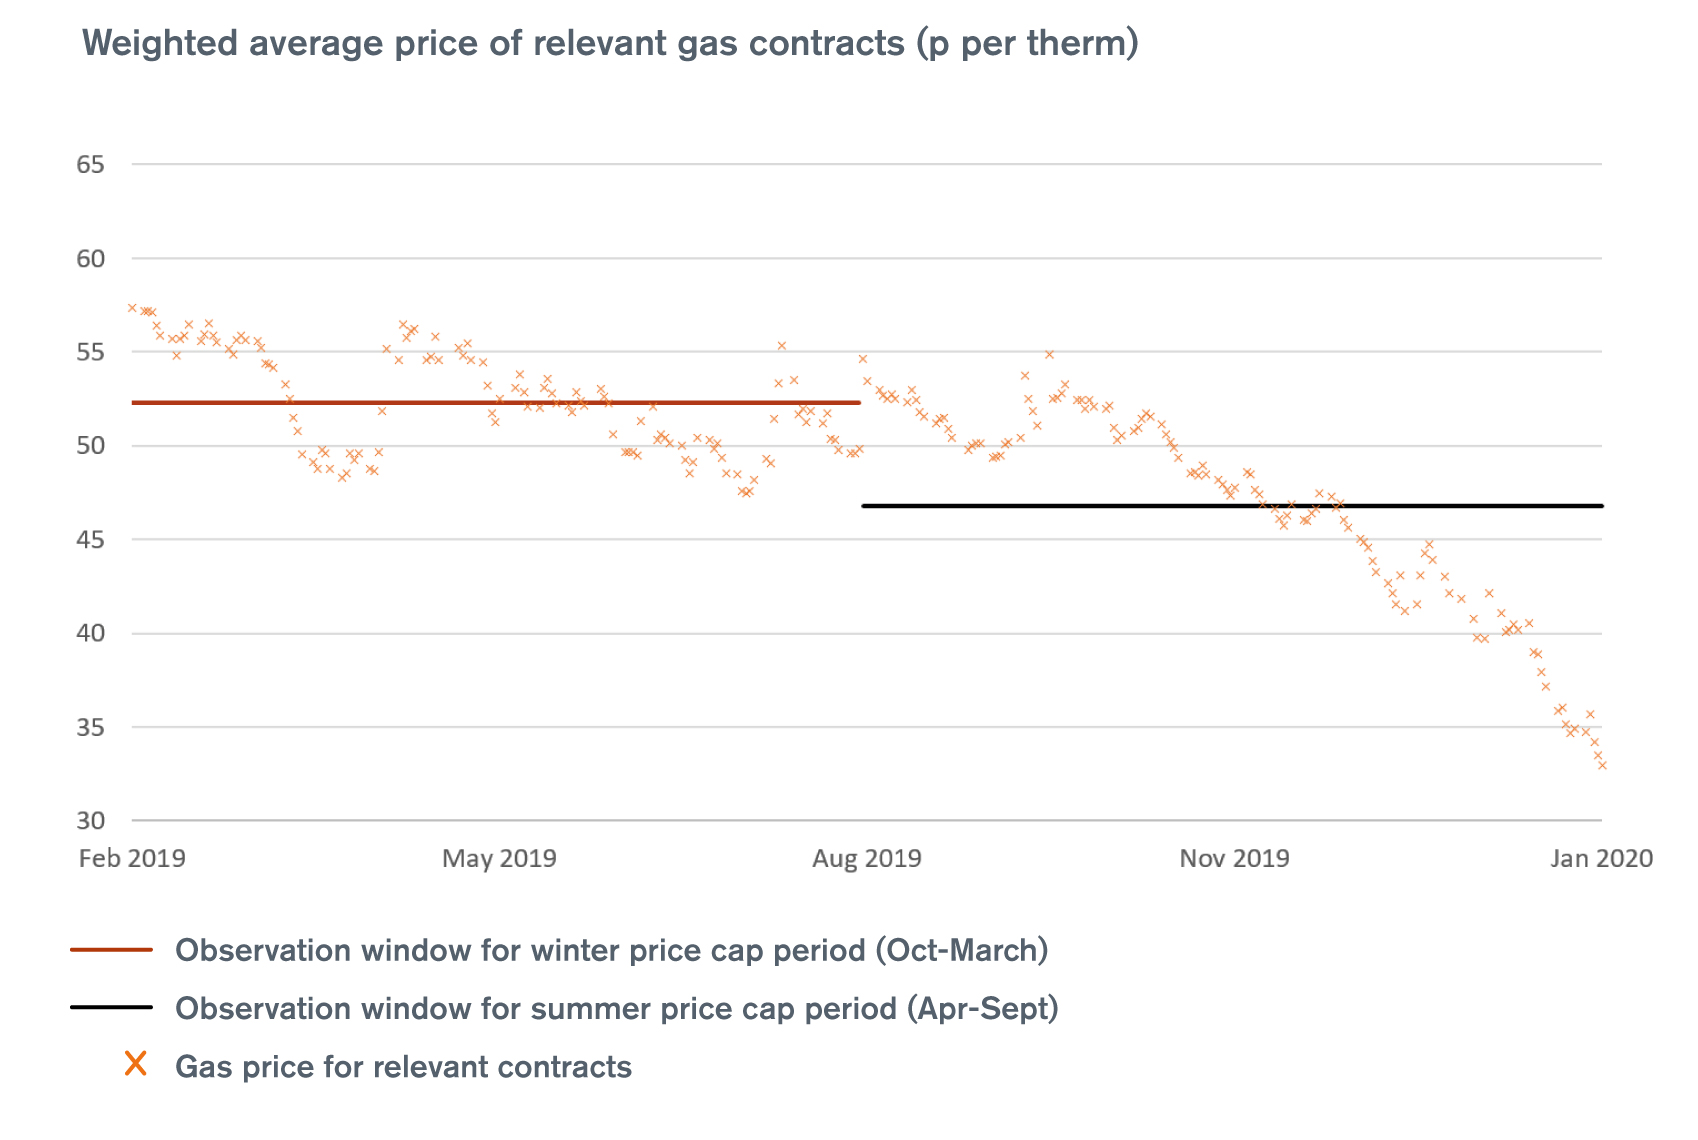
Data sets behind this graph are proprietary, and can be sourced from ICIS
5. The values shown in the text include VAT, and are expressed for the current Typical Domestic Consumption Values (TDCV) of 3,100kWh of electricity, 12,000kWh of gas, and 4,200kWh of electricity for Economy 7.
The TDCVs will be updated on 1st April 2020 to reflect decreasing average consumption (2,900kWh of electricity, 12,000kWh of gas, and 4,200kWh of electricity for Economy 7). From this date, Ofgem will use the new TDCVs to express the default tariff price cap and prepayment meter cap in all publications. Previous publications on the levels of the caps will therefore not be exactly the same.
6. From 1 April the equivalent per unit level of the default price cap to the nearest pence (figures for pre-payment meter price cap in brackets) for a typical customer paying by direct debit will be 18p per kWh (18p per kWh) for electricity customers and 4p per kWh (3p per kWh) for gas customers.
7. Breakdown of caps:
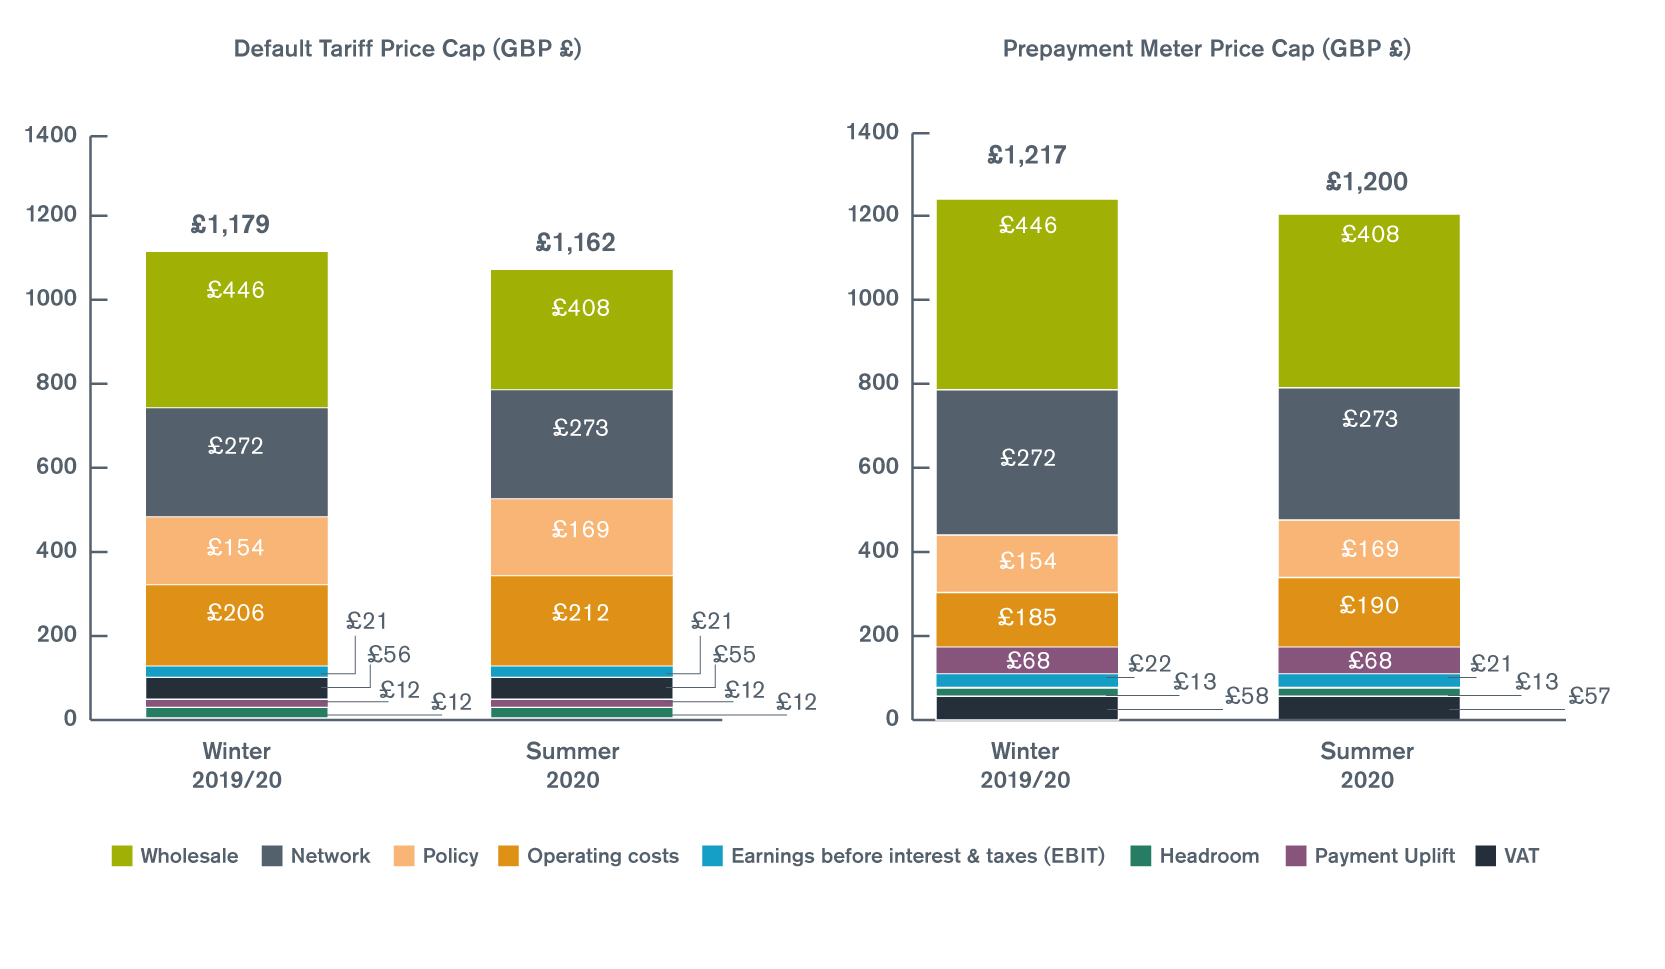
Data for the graphs can be found on the default tariff price cap page.
8. The £305 switching saving figure is from the average of the 10 cheapest tariffs offered by suppliers in the market (one tariff per supplier). Where each tariff is based on the dual fuel average available paperless tariff paid by direct debit with typical domestic consumption values at 28 December 2019.
9. To date, Ofgem has secured over £3 million in compensation and redress for price cap overcharging from four suppliers, as well as opening a formal investigation into another supplier.
10. Information and materials for consumers about the price caps is available at: www.ofgem.gov.uk/energy-price-caps
Further Information
For media, contact
Michelle Amos: 020 7901 1881
Media out of hours mobile: 07766 511470 (media calls only)
General enquiries (non-media)
If you are an energy customer looking for help and advice, including complaints about energy firms, please see our Household gas and electricity guide. Citizens Advice also provide a free, impartial helpline service across a range of issues on 03454 040506.
We also regularly share news and post general advice to help consumers get the most out of their energy services via our @Ofgem twitter and Facebook pages. If you have an enquiry or complaint relating to Ofgem’s policies or functions, contact us at consumeraffairs@ofgem.gov.uk or on 020 7901 7295.
For all other non-media related enquiries, please visit our Contact us page.
About Ofgem
Ofgem is the independent energy regulator for Great Britain. Its priority is to make a positive difference for consumers by promoting competition in the energy markets and regulating networks.
For facts, figures and information about Ofgem’s work, see Energy facts and figures or visit the Ofgem Data Portal.
For energy insights and updates straight to your inbox from Ofgem, please subscribe.
Follow us on Twitter @ofgem, LinkedIn and Facebook.