Data on Ofgem.gov.uk
- Ian Green

- Publication type:
- Blog
- Publication date:
Related links
You may have noticed a change to your main menu navigation options on Ofgem.gov.uk following the release of the new interactive Ofgem Data Portal. Our senior communications manager for digital, Ian Green, describes how you can now access data and information on the GB energy market in a single space, and explains some of the features we're exploring to ensure a user-first online data experience.
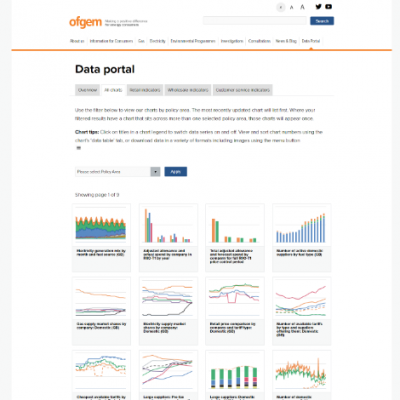
The newly launched Ofgem Data Portal.
Our data story so far
Back in summer 2013, we launched the current version of the Ofgem website.
When we did this, we took a tentative step into the world of interactive data visualisation, by building some basic online charts using numbers from an existing public report. It was simple and the content sat unheralded in a specific part of the website while we gauged both internal and external appetite for presenting statistical information in this way.
Fast-forward almost three years, and the variety, complexity and volume of information we publish in this way has increased hugely. So much so that it became clear that users really needed to access all of our growing interactive data sets within a single location, with links through to deeper information and analysis if they wished to delve further.
That single location is now the Ofgem Data Portal, launched on 31 March and easily findable via the top navigation bar of the website (you’ll see it to the right-hand side next to News & Blog above).
Portal features
In this portal, we’ve inserted an “All charts” tab that you can use to view all of our interactive data charts relevant to the gas and electricity markets.
You can filter the charts by pre-defined themes, and you can manipulate the views in individual charts by clicking on legends, dragging scrollbars and so on. You can also download data in various formats, including .png images files and .csv data files.
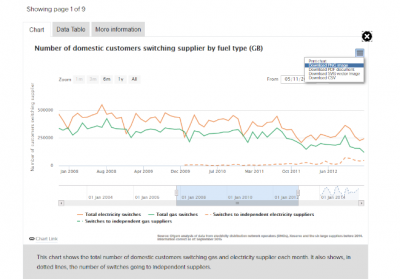
New chart options: Drag scroll bars to delve into data and use the menu button to download views.
Going forward
There are two points worth stressing on the work we have done, and will continue to do, in the way we make this data available to the public:
- This work contributes to fulfilling our regulatory duties and our commitment to making a positive difference to the consumer. It’s not an exercise in making content look nicer.
We want to be transparent, and ensure that energy issues are debated in an informed way. We contribute to this by providing data that’s accurate and impartial. As the independent regulator in GB, we use data to monitor the market and where suppliers and companies fail we take action. These numbers are used to support our analyses and decisions, and are there for all to see and share.
- From the online experience point of view, our new Data Portal is an important step forwards, but we know it’s not complete. We already have additional features planned, such as a search function that will go live later in the year. What matters above all else is how this information works for you, the user. The more we know about that, the more we can iterate and improve, so please do look out for the survey we’re planning for the autumn.
Watch our video above for a short run-through on how to get the most out of the Portal.